ClickHouse is a database that aims to provide “lightning fast analytics for everyone.” They have published several resources online about how they strive toward making ClickHouse as fast as possible, including Why is ClickHouse so fast?
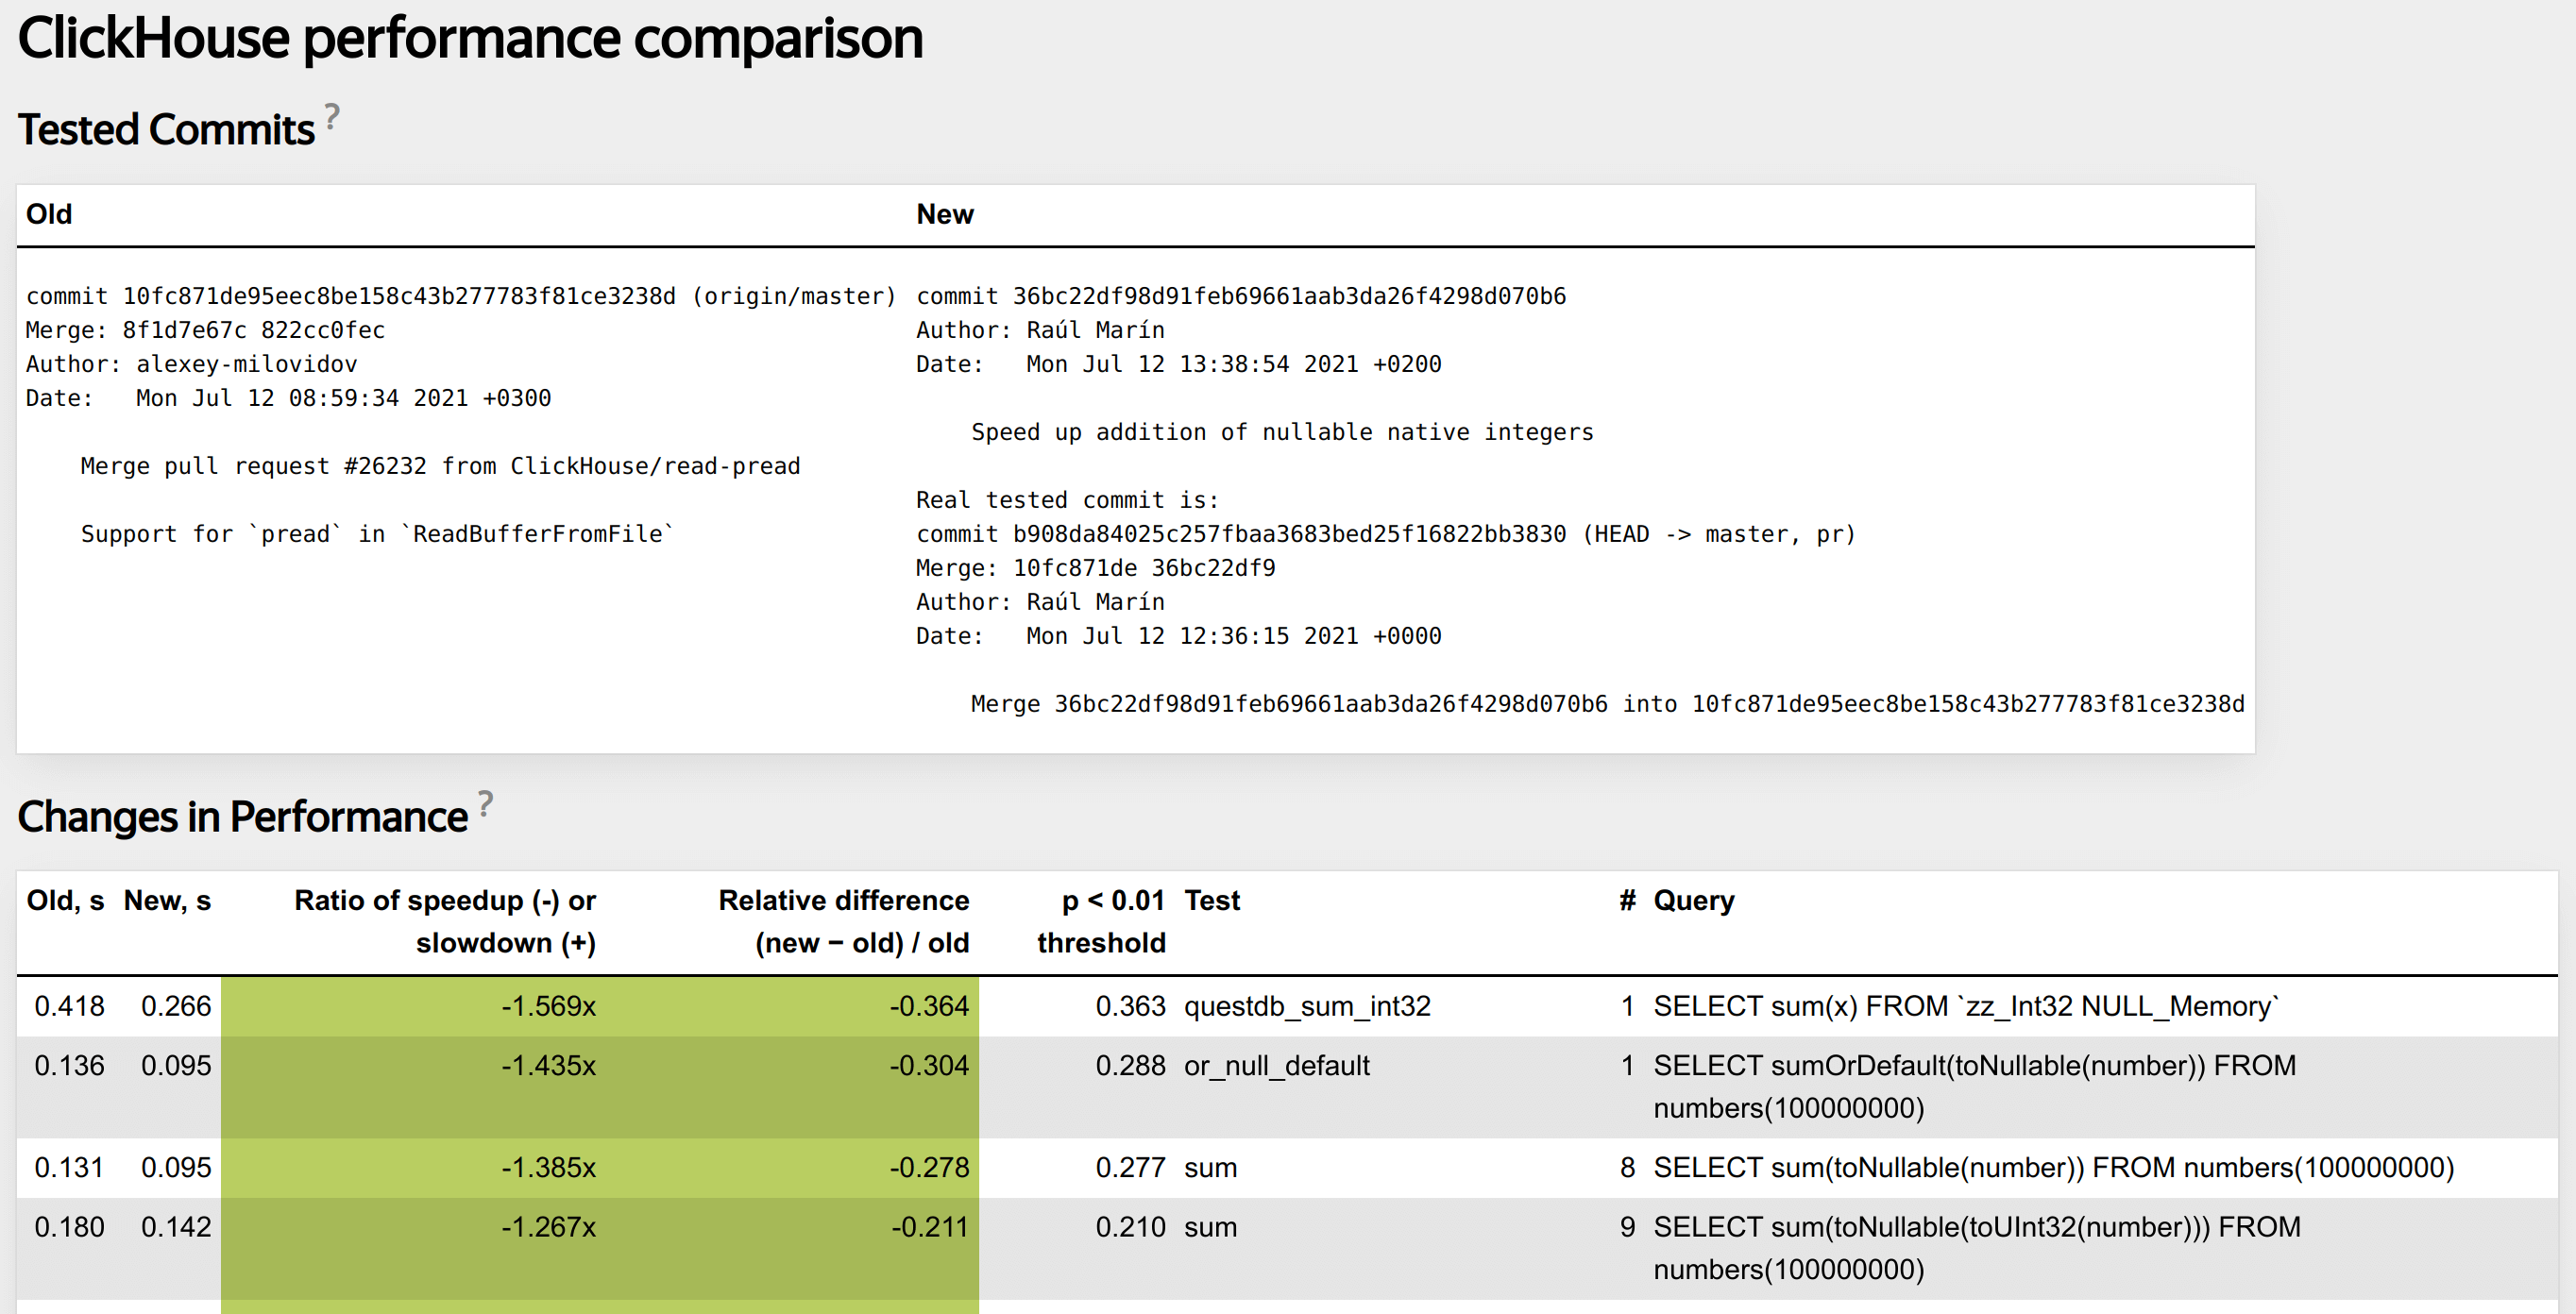
In one post, Testing the Performance of ClickHouse, they outline a “ClickHouse comparison tool” that lets developers see how the performance of the engine changes on a set of tests on a commit-by-commit level. This is displayed in what looks like a web interface, with colours indicating changes in performance.

I wish I had a tool like this in Python, ideally integrated with pytest, that allowed me to measure performance changes per commit.
For my search engine, I have a series of tests that run and validate that query time was below a certain threshold. This helps prevent against significant performance regressions. With that said, having a manual threshold above which a test fails doesn’t tell me about subtle changes in performance that build up over time. This arrangement alerts me when something is wrong, whereas the ideal system would tell me when something is wrong, and tell me when things are a bit slower, and tell me when things are faster.
Ideally, on commit, an Action would start up that runs all tests three times and saves the results to a file. These results can then be visualized in a view similar to the one above, showing the old and new performance numbers. Comparisons could also be drawn to the last release, allowing me to see more clearly how successive changes have contributed to performance improvements.
The Action could then display results on a web page.
It may be the case that I would need to build something custom for my use case, but I wonder if there is a more abstract integration that could be made that works with pytest.
In another realm of development, Google has built Lighthouse CI, which allows you to integrate Google Lighthouse performance tests for web pages directly into your continuous integration system. This achieves the same goals as the infrastructure ClickHouse made for themselves: proactively monitor performance, and have visualizations that let you monitor and evaluate improvements and regressions in performance.


